Borough vs Violation
Borough vs. Inspection summary result
We examined the inspection categories of child care centers in different areas of New York that had records of violations,We found that the categories of inspection are divided into four major categories, which are Compliance Inspection of Open Violations, Initial Annual Inspection, Lead Based Paint or Lead in Water Inspection, Monitoring Inspection Non-Routine.
borough_inspec_summmary<-
  Childcare_center%>%
  select(borough,inspection_summary_result)%>%
  drop_na(inspection_summary_result)%>%
  group_by(borough,inspection_summary_result)%>%
  summarise(
    n_obs=n()
  )%>%
  mutate(
    general_category=case_when(
      inspection_summary_result %like% "^Compliance Inspection of Open Violations" ~"Compliance Inspection of Open Violations",
      inspection_summary_result %like% "^Initial Annual Inspection" ~"Initial Annual Inspection",
      inspection_summary_result %like% "^Lead Based Paint or Lead in Water Inspection" ~"Lead Based Paint or Lead in Water Inspection",
      inspection_summary_result %like% "^Monitoring Inspection Non-Routine" ~"Monitoring Inspection Non-Routine")
  )
head(borough_inspec_summmary)
## # A tibble: 6 × 4
## # Groups: borough [1]
## borough inspection_summary_result n_obs gener…¹
## <chr> <chr> <int> <chr>
## 1 BRONX Compliance Inspection of Open Violations - Passed inspe… 96 Compli…
## 2 BRONX Compliance Inspection of Open Violations - Previously c… 29 Compli…
## 3 BRONX Compliance Inspection of Open Violations - Previously c… 3 Compli…
## 4 BRONX Compliance Inspection of Open Violations - Reinspection… 48 Compli…
## 5 BRONX Compliance Inspection of Open Violations - Reinspection… 94 Compli…
## 6 BRONX Compliance Inspection of Open Violations - Reinspection… 92 Compli…
## # … with abbreviated variable name ¹general_categoryTo better examine the number of violations in different types of inspections at child care centers in different borough of New York, we categorized and summarise the records of violation inspections by borough and type of inspection.
Borough group by General Category
borough_inspec_general_sumary<-
  borough_inspec_summmary%>%
  group_by(borough,general_category)%>%
  summarise(
    n_obs=sum(n_obs)
  ) %>%
  arrange(desc(n_obs))
borough_inspec_general_sumary
## # A tibble: 19 × 3
## # Groups: borough [5]
## borough general_category n_obs
## <chr> <chr> <int>
## 1 QUEENS Initial Annual Inspection 3208
## 2 BROOKLYN Initial Annual Inspection 2852
## 3 MANHATTAN Initial Annual Inspection 1687
## 4 BRONX Initial Annual Inspection 1586
## 5 BRONX Compliance Inspection of Open Violations 521
## 6 MANHATTAN Monitoring Inspection Non-Routine 468
## 7 BROOKLYN Compliance Inspection of Open Violations 457
## 8 STATEN ISLAND Initial Annual Inspection 401
## 9 QUEENS Compliance Inspection of Open Violations 390
## 10 BROOKLYN Monitoring Inspection Non-Routine 301
## 11 BRONX Monitoring Inspection Non-Routine 284
## 12 QUEENS Monitoring Inspection Non-Routine 249
## 13 STATEN ISLAND Monitoring Inspection Non-Routine 141
## 14 MANHATTAN Compliance Inspection of Open Violations 68
## 15 STATEN ISLAND Compliance Inspection of Open Violations 32
## 16 BRONX Lead Based Paint or Lead in Water Inspection 10
## 17 BROOKLYN Lead Based Paint or Lead in Water Inspection 10
## 18 MANHATTAN Lead Based Paint or Lead in Water Inspection 6
## 19 QUEENS Lead Based Paint or Lead in Water Inspection 5We also created the following chart by type of inspection and the number of violations recorded. We found that New York’s child care centers had the highest number of violations in the intial annual inspection, far exceeding the other three types of violations combined, with the Queen’s district having the highest number of violations at 3,600 records. In contrast, Lead Based Paint or Lead in Water Inspection had the least number of violations, with bronx having ten records, Brooklyn having eleven records, Manhattan having six records, queens having five records, and staten island not even having this type of record.
borough_inspec_general_sumary_plot_all<-
  borough_inspec_general_sumary%>%
  ggplot(aes(x=general_category,y=n_obs),)+
  geom_bar(aes(fill = borough), stat = "identity")+
  theme(axis.text.x = element_text(size=10, angle=45, hjust = 1))+
  labs(y="number of violations",title="Inspection categories vs. Borough",x="inspection categories")

ggplotly(borough_inspec_general_sumary_plot_all)
General Type vs Borough
inspec_general_borough_sumary<-
borough_inspec_summmary%>%
group_by(general_category,borough)%>%
summarise(
n_obs=sum(n_obs)
) %>%
  arrange(desc(n_obs))
inspec_general_borough_sumary
## # A tibble: 19 × 3
## # Groups: general_category [4]
## general_category borough n_obs
## <chr> <chr> <int>
## 1 Initial Annual Inspection QUEENS 3208
## 2 Initial Annual Inspection BROOKLYN 2852
## 3 Initial Annual Inspection MANHATTAN 1687
## 4 Initial Annual Inspection BRONX 1586
## 5 Compliance Inspection of Open Violations BRONX 521
## 6 Monitoring Inspection Non-Routine MANHATTAN 468
## 7 Compliance Inspection of Open Violations BROOKLYN 457
## 8 Initial Annual Inspection STATEN ISLAND 401
## 9 Compliance Inspection of Open Violations QUEENS 390
## 10 Monitoring Inspection Non-Routine BROOKLYN 301
## 11 Monitoring Inspection Non-Routine BRONX 284
## 12 Monitoring Inspection Non-Routine QUEENS 249
## 13 Monitoring Inspection Non-Routine STATEN ISLAND 141
## 14 Compliance Inspection of Open Violations MANHATTAN 68
## 15 Compliance Inspection of Open Violations STATEN ISLAND 32
## 16 Lead Based Paint or Lead in Water Inspection BRONX 10
## 17 Lead Based Paint or Lead in Water Inspection BROOKLYN 10
## 18 Lead Based Paint or Lead in Water Inspection MANHATTAN 6
## 19 Lead Based Paint or Lead in Water Inspection QUEENS 5The following chart can better understand the violation situation of different Boroughs in New York. We can see that queens has the most violation records, Brooklyn has less violation records than queens but still far more than bronx and Manhattan, and staten island has the least violation records.
violation_borough_sumary_all<-
inspec_general_borough_sumary%>%
ggplot(aes(x=borough,y=n_obs))+
geom_bar(aes(fill=general_category),stat = "identity")+
theme(axis.text.x = element_text(size=10, angle=45, hjust = 1))+
  labs(y="number of violations",title="Borough vs.Inspection categories",x="borough")

ggplotly(violation_borough_sumary_all)
Borough vs Violation Category
Childcare_center %>%
  mutate(violation_category = ifelse(is.na(violation_category), "NO VIOLATION", violation_category)) %>%
  group_by(borough, age_range) %>%
  count(violation_category) %>%
  ggplot(aes(fill =violation_category, x=borough,y = n))+
  geom_bar(position = "dodge", stat = "identity")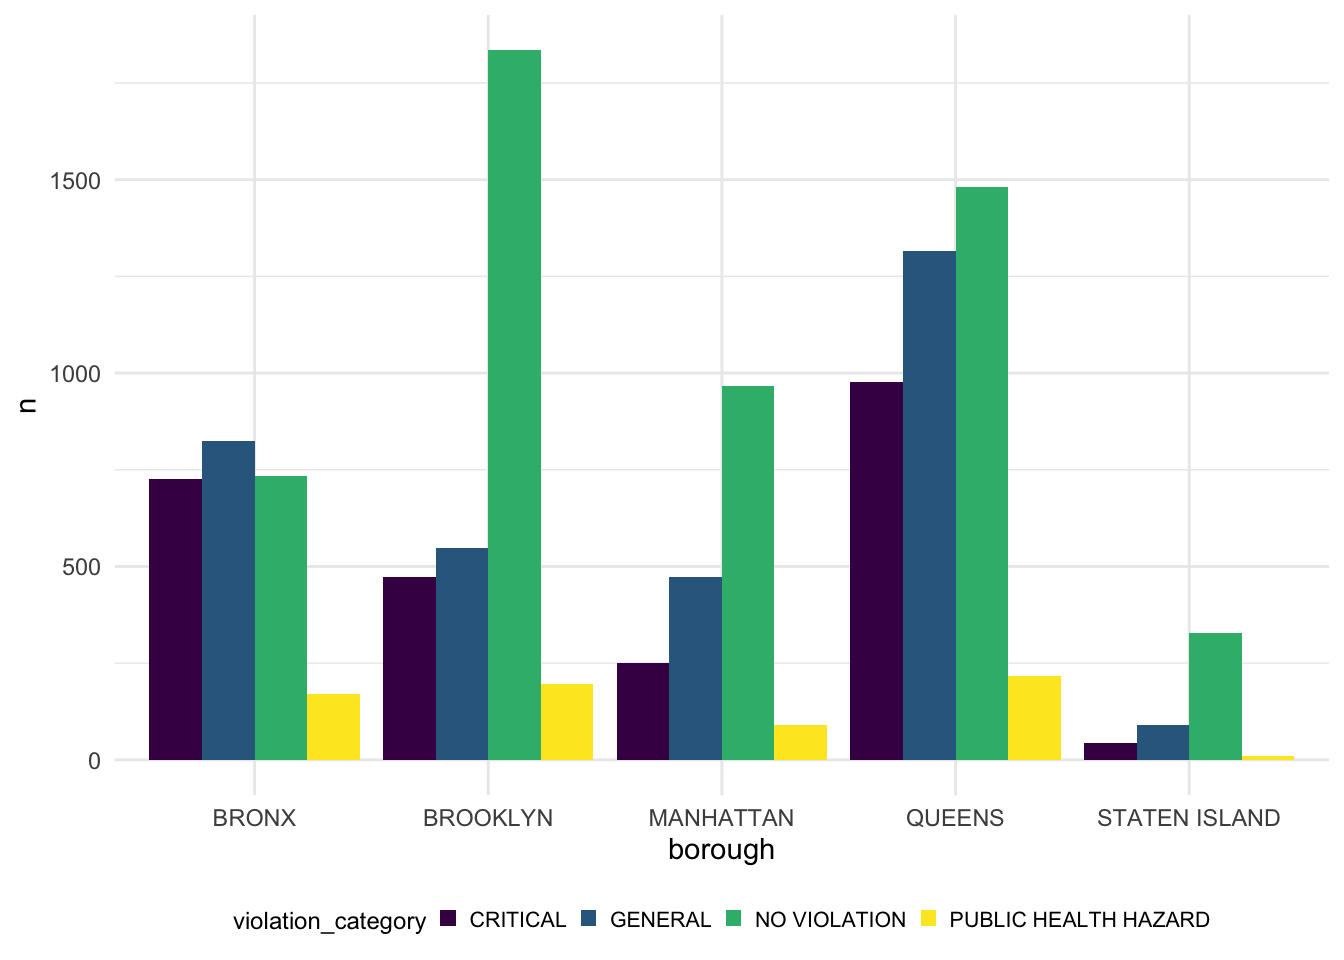
The graph above showing the relationship between the borough and the cases of violation in each category. From the grpah we can see, queens is the borough whihc has the most violation cases in all three categories and staten island has the least violation cases in all three categories. And in Brooklyn, it has the highest no violation cases.
# try
try = Childcare_center %>%
  select(borough,program_type,violation_category)%>%
  filter(program_type!="CAMP")%>%
  group_by(borough, program_type,violation_category) %>%
  summarise(
    n_obs=n())%>%
  ggplot(aes(x = borough, y = n_obs, fill = violation_category))+
  geom_bar(stat="identity", width = 0.5, position = "dodge")+
  facet_grid(. ~ program_type) +
  theme_bw() +
  theme(axis.text.x = element_text(angle = 28),axis.text = element_text(size = 5))+ labs(title = "Borough vs Violation Categrory in differnt Program Types",y = "Total Violation Cases", x = "Borough")

ggplotly(try)
The graph above is showing the relationship between borough and the number of violation category count in two different program types. The borough can separate the five parts “Bronx”, “Brooklyn”, “Manhattan”, “Staten Island” and “Queens”. Violation category can be separate “Critical”, “General”, “No Violation” and “Public Health Hazard”. Combining two graphs, preschool will have a higher violation case in each borough in overall. In infant toddler, Brooklyn is the borough that having the largest violation cases. But in preschool, queens is the borough that having the largest cases. Staten island has the smallest cases in both preschool and infant toddler.